Introduction to gimVI#
Imputing missing genes in spatial data from sequencing data with gimVI#
import tempfile
import rapids_singlecell as rsc

import anndata
import matplotlib.pyplot as plt
import numpy as np
import scanpy as sc
import scvi
import scviva
import scviva
import seaborn as sns
import torch
from scipy.stats import spearmanr
from scvi.data import cortex, smfish
from scviva.model import GIMVI
scviva.settings.seed = 0
print("Last run with scviva version:", scviva.__version__)
Seed set to 0
Last run with scvi-tools version: 0.1.0
scvi.settings.seed = 0
print("Last run with scvi-tools version:", scvi.__version__)
Note
You can modify save_dir below to change where the data files for this tutorial are saved.
sc.set_figure_params(figsize=(6, 6), frameon=False)
sns.set_theme()
torch.set_float32_matmul_precision("high")
save_dir = tempfile.TemporaryDirectory()

%config InlineBackend.print_figure_kwargs={"facecolor": "w"}
%config InlineBackend.figure_format="retina"
train_size = 0.8
spatial_data = smfish(save_path=save_dir.name, use_high_level_cluster=False)
seq_data = cortex(save_path=save_dir.name)
Downloading data from 'https://exampledata.scverse.org/scvi-tools/smfish.h5ad' to file '/tmp/tmp2uk5td8d/smfish.h5ad'.
INFO Downloading file at /tmp/tmp2uk5td8d/expression.bin
INFO     Loading Cortex data from /tmp/tmp2uk5td8d/expression.bin
INFO     Finished loading Cortex data
/opt/anaconda3/envs/scvi_new/lib/python3.13/functools.py:934: ImplicitModificationWarning: Transforming to str index.
  return dispatch(args[0].__class__)(*args, **kw)
Preparing the data#
In this section, we hold out some of the genes in the spatial dataset in order to test the imputation results
# only use genes in both datasets
seq_data = seq_data[:, spatial_data.var_names].copy()

seq_gene_names = seq_data.var_names
n_genes = seq_data.n_vars
n_train_genes = int(n_genes * train_size)

# randomly select training_genes
rand_train_gene_idx = np.random.choice(range(n_genes), n_train_genes, replace=False)
rand_test_gene_idx = sorted(set(range(n_genes)) - set(rand_train_gene_idx))
rand_train_genes = seq_gene_names[rand_train_gene_idx]
rand_test_genes = seq_gene_names[rand_test_gene_idx]

# spatial_data_partial has a subset of the genes to train on
spatial_data_partial = spatial_data[:, rand_train_genes].copy()

# remove cells with no counts
sc.pp.filter_cells(spatial_data_partial, min_counts=1)
sc.pp.filter_cells(seq_data, min_counts=1)

# setup_anndata for spatial and sequencing data
GIMVI.setup_anndata(spatial_data_partial, labels_key="labels", batch_key="batch")
GIMVI.setup_anndata(seq_data, labels_key="labels")

# spatial_data should use the same cells as our training data
# cells may have been removed by scanpy.pp.filter_cells()
spatial_data = spatial_data[spatial_data_partial.obs_names]
Creating the model and training#
model = GIMVI(seq_data, spatial_data_partial)
model.train(max_epochs=200)
GPU available: True (cuda), used: True
TPU available: False, using: 0 TPU cores
💡 Tip: For seamless cloud logging and experiment tracking, try installing [litlogger](https://pypi.org/project/litlogger/) to enable LitLogger, which logs metrics and artifacts automatically to the Lightning Experiments platform.
LOCAL_RANK: 0 - CUDA_VISIBLE_DEVICES: [0]
/opt/anaconda3/envs/scvi_new/lib/python3.13/site-packages/lightning/pytorch/utilities/_pytree.py:21: `isinstance(treespec, LeafSpec)` is deprecated, use `isinstance(treespec, TreeSpec) and treespec.is_leaf()` instead.
/opt/anaconda3/envs/scvi_new/lib/python3.13/site-packages/lightning/pytorch/trainer/connectors/data_connector.py:434: The 'train_dataloader' does not have many workers which may be a bottleneck. Consider increasing the value of the `num_workers` argument` to `num_workers=63` in the `DataLoader` to improve performance.
`Trainer.fit` stopped: `max_epochs=200` reached.
Analyzing the results#
Getting the latent representations and plotting UMAPs#
# get the latent representations for the sequencing and spatial data
latent_seq, latent_spatial = model.get_latent_representation()

# concatenate to one latent representation
latent_representation = np.concatenate([latent_seq, latent_spatial])
latent_adata = anndata.AnnData(latent_representation)

# labels which cells were from the sequencing dataset and which were from the spatial dataset
latent_labels = (["seq"] * latent_seq.shape[0]) + (["spatial"] * latent_spatial.shape[0])
latent_adata.obs["labels"] = latent_labels

# compute umap
rsc.pp.neighbors(latent_adata, use_rep="X")
rsc.tl.umap(latent_adata)

# save umap representations to original seq and spatial_datasets
seq_data.obsm["X_umap"] = latent_adata.obsm["X_umap"][: seq_data.shape[0]]
spatial_data.obsm["X_umap"] = latent_adata.obsm["X_umap"][seq_data.shape[0] :]
/tmp/ipykernel_1069622/1264898024.py:18: ImplicitModificationWarning: Setting element `.obsm['X_umap']` of view, initializing view as actual.
  spatial_data.obsm["X_umap"] = latent_adata.obsm["X_umap"][seq_data.shape[0] :]
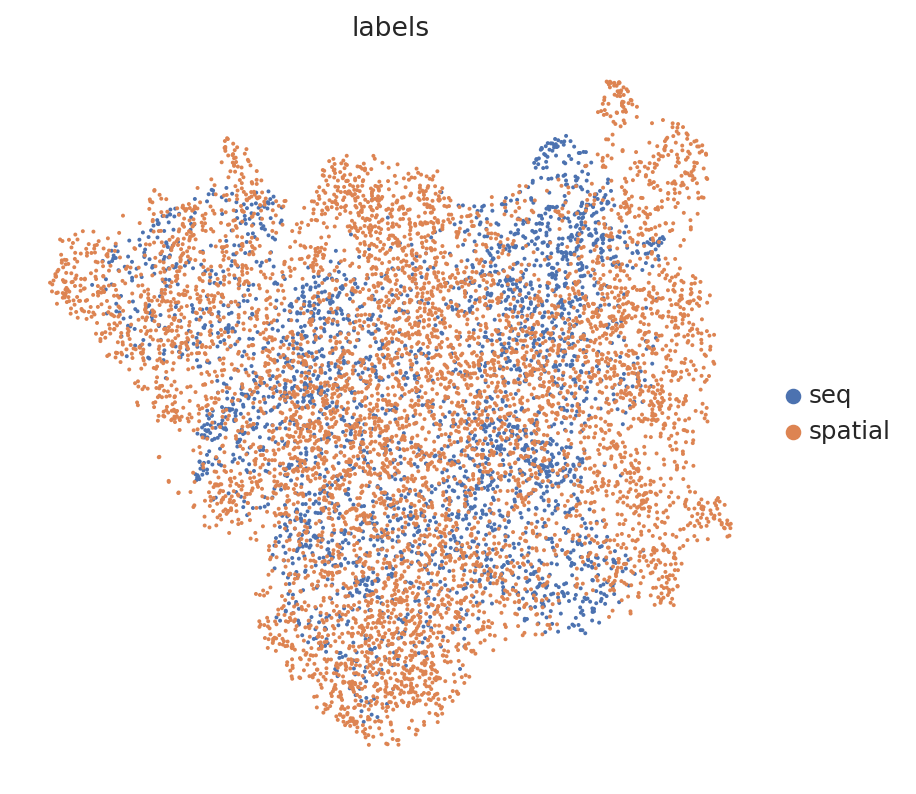
# umap of the combined latent space
sc.pl.umap(latent_adata, color="labels", show=True)
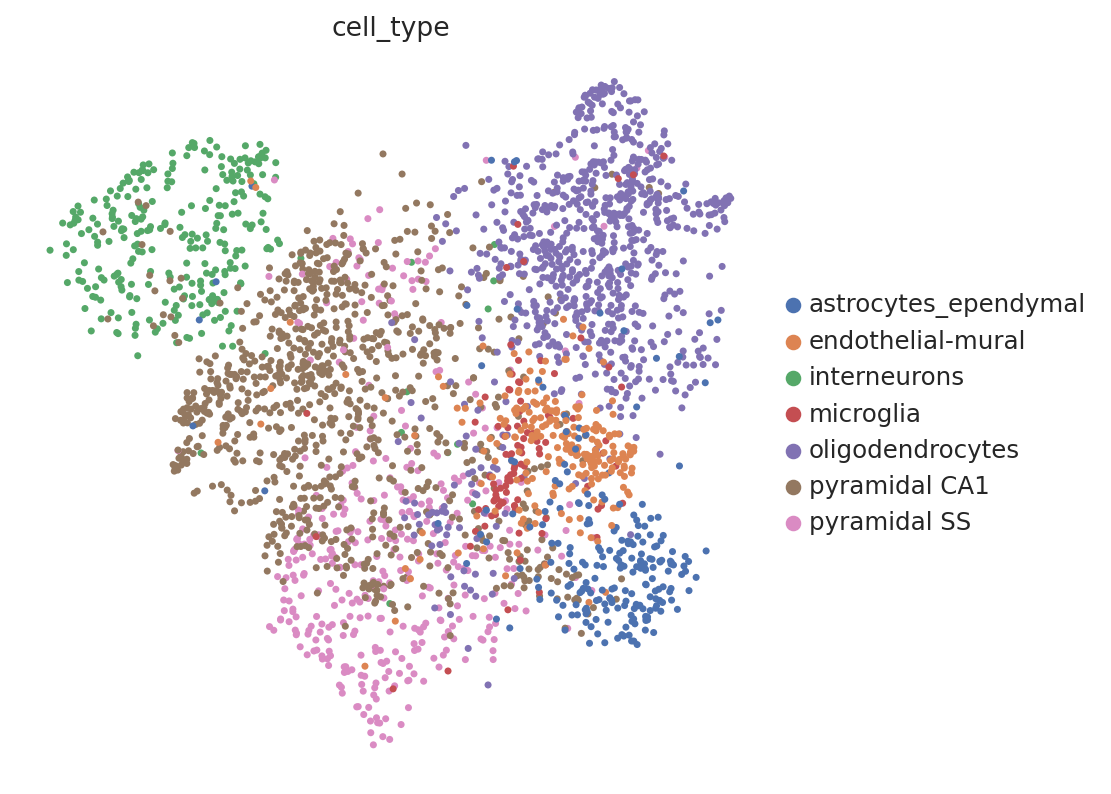
# umap of sequencing dataset
sc.pl.umap(seq_data, color="cell_type")
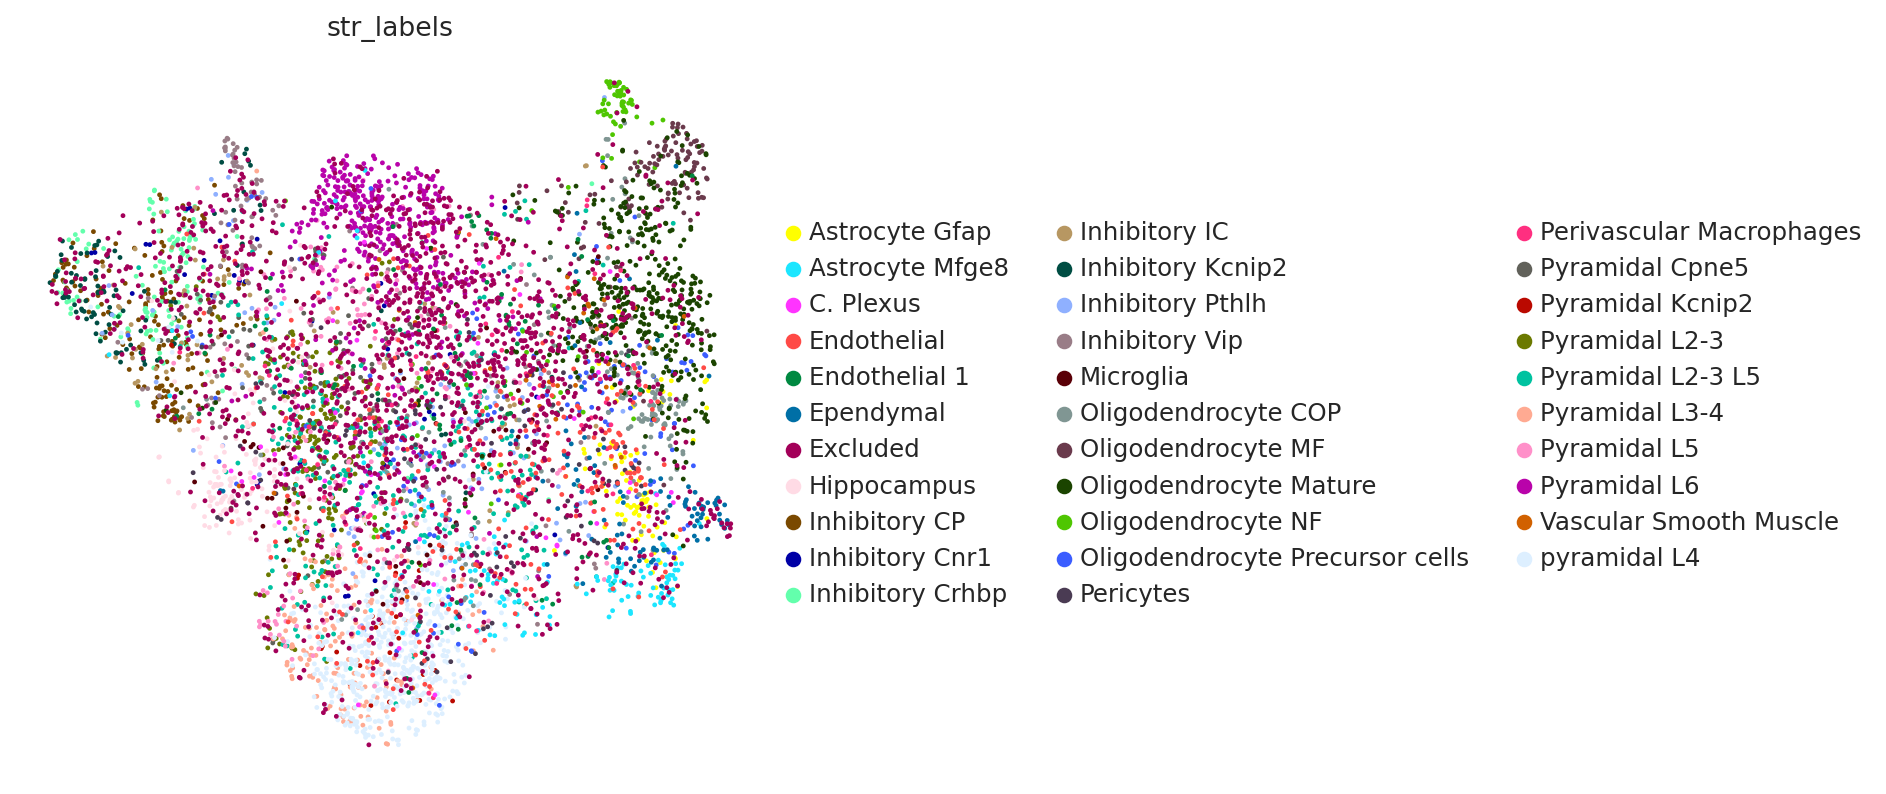
# umap of spatial dataset
sc.pl.umap(spatial_data, color="str_labels")
Getting Imputation Score#
imputation_score() returns the median spearman r correlation over all the cells
# utility function for scoring the imputation


def imputation_score(model, data_spatial, gene_ids_test, normalized=True):
    _, fish_imputation = model.get_imputed_values(normalized=normalized)
    original, imputed = (
        data_spatial.X[:, gene_ids_test],
        fish_imputation[:, gene_ids_test],
    )

    if normalized:
        original = original / data_spatial.X.sum(axis=1).reshape(-1, 1)

    spearman_gene = []
    for g in range(imputed.shape[1]):
        if np.all(imputed[:, g] == 0):
            correlation = 0
        else:
            correlation = spearmanr(original[:, g], imputed[:, g])[0]
        spearman_gene.append(correlation)
    return np.median(np.array(spearman_gene))


imputation_score(model, spatial_data, rand_test_gene_idx, True)
np.float64(0.13184392561696717)